Documentation
Learn how BRIO2 works, how to format your data, and how to interpret results.
Info
BRIO (BEAM RNA Interaction mOtifs) is a web server designed to identify known sequence and structural protein-binding motifs within RNA molecules of interest. BRIO is intended for users working with collections of RNA sequences who aim to detect sequence or structural motifs involved in interactions with RNA-binding proteins or protein domains.
The current BRIO motif dataset integrates experimentally derived RNA–protein interaction data obtained from CLIP-seq and ten related high-throughput technologies: HITS-CLIP, PAR-CLIP, iCLIP, eCLIP, iCLAP, urea-iCLIP, 4sU-iCLIP, BrdU-CLIP, Fr-iCLIP, and PIP-seq. The dataset covers seven different species: Homo sapiens, Mus musculus, Drosophila melanogaster, Caenorhabditis elegans, Danio rerio, Saccharomyces cerevisiae, and Arabidopsis thaliana.
Overall, the dataset comprises 16,597 motifs, including 8,305 sequence-based motifs and 8,292 structure-based motifs, associated with 422 unique RNA-binding proteins (RBPs) and protein domains.
The search is based on the BEAM algorithm for motifs finding (Pietrosanto et al., 2016).
Input
Users can either insert the RNA sequence(s) of interest directly into the text area or provide the sequence and the corresponding secondary structure in dot-bracket notation, using the multiFASTA format. Alternatively, a file upload option is available. Sequences submitted without secondary structure information are automatically folded using the RNAfold program (Lorenz et al., 2011).
RNA molecules must be at least 3 nucleotides long and shorter than 3000. For structural motif searches, input sequences should be at least 50 nucleotides long. A maximum of 100 sequences can be submitted per job.
AGCACUUUGCGAGUCUUCAUUUGCAUACGGGCUCUAUAAGUAGCGCAUAACCAGCCCGUUUUGCGGUAGUUCGGAUUACUUCUUUAAGUCUCUUUUCUCUUUUUUCGCGCAAAAAUGCCGGAUCCAGCGAAAUCCGCUCCUGCUCCCAAGAAGGGCUCCAAAAAGGCUGUUACGAAAGUGCAGAAGAAGGACGGCAAGAAGCGCAAGCGCAGCCGCAAGGAGAGCUACUCCGUUUACGUGUACAAGGUGCUGAAGCAGGUCCACCCCGACACCGGCAUCUCGUCCAAGGCCAUGGGCAUCAUGAACUCCUUCGUCAACGACAUCUUCGAGC
.(((((((..((((((............)))))).....(((((((......(((((.(((((.(((((..((((((((((....))))......((.((...((((.(((....)))))))...)).))))))))...)))))..))))).)))))........)).))))).))))))).((.((((((((((.....((....))...))))...((((.....)))).............((((((((..(..((......))..)..)))))))).(((((......))))).........)))))).))..(((.....)))...
>chr1:149784741-149784985(-)
CUUCCAGAGCUCGGCCGUGAUGGCGCUGCAGGAGGCCAGCGAGGCCUACCUGGUGGGGCUGUUCGAAGACACGAACCUGUGCGCCAUCCAUGCCAAGCGCGUGACCAUCAUGCCCAAGGACAUCCAGUUGGCCCGCCGCAUCCGCGGGGAGCGGGCCUAAGGCAUAUUUUUAAGUGGUCGAUCUAAAGGCUCUUUUCAGAGCCACUGCCGUUUUCAUCAAGAGCAGCUGUACCGGCUCUCCAUC
.....(((((.(((..(.((((((((.(((((((.((.((.(((....))).)).)).)).((((......))))))))))))))))))((((.....))))((((((.(((((...((....))....(((((((....(((....))))))))))...)))))........))))))........((((((....))))))((.((.(((((.....))))).)).)).)))))))).....
Users can customize the search space by selecting specific organisms and experimental datasets. As shown in the image below, these parameters are managed via intuitive selection boxes. You can choose to compare sequences against the entire dataset or filter by one of the seven supported species (Homo sapiens, Mus musculus, Drosophila melanogaster, Caenorhabditis elegans, Danio rerio, Saccharomyces cerevisiae, and Arabidopsis thaliana). Similarly, you may filter by specific experimental technologies (e.g., HITS-CLIP, PAR-CLIP, iCLIP, eCLIP, iCLAP, urea-iCLIP, 4sU-iCLIP, BrdU-CLIP, Fr-iCLIP, or PIP-seq).
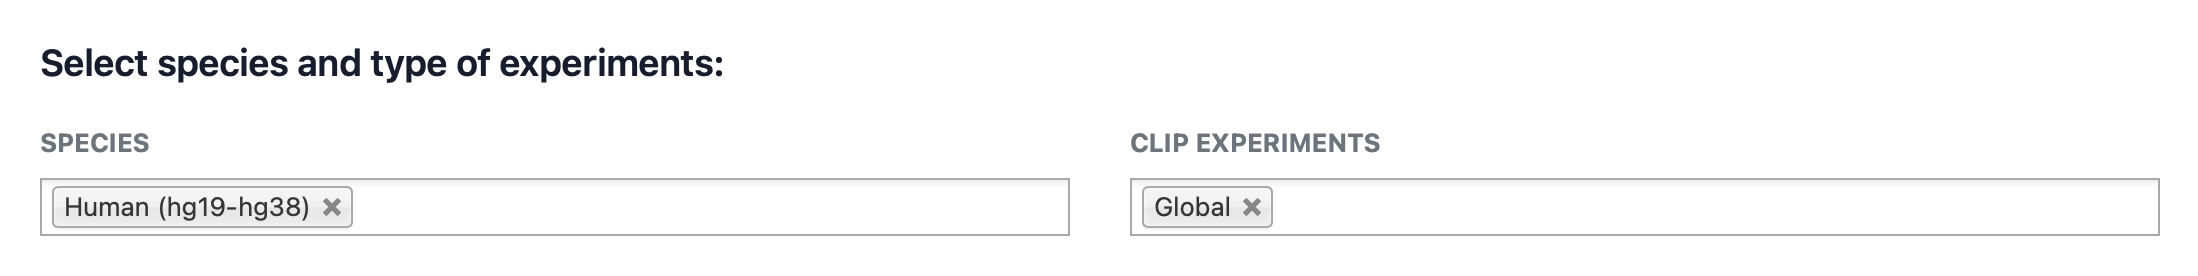
Additional selection options:
- Select all CLIP experiments: A shortcut to include all CLIP-based technologies in the analysis.
- GLOBAL mode: This mode aggregates all experiments associated with the same RNA-binding protein (RBP), performing motif discovery once per RBP to provide a more compact result set.
To add a species or experiment, click on the respective field. To remove an entry, click the “X” icon displayed next to the selected item.
Method
BRIO uses the substitution matrices (classic MBR, Matrix of Bear encoded RNA, for structure, and classic substitution matrix for nucleotides, with 3 for nucleotide matching and -2 otherwise), and scans the models in any single input RNA using a sliding-window ungapped alignment keeping the best match that, at the end, is compared to the original minimum score of the model.
BRIO returns a collection of protein binding motifs identified in the input RNA molecules, with related statistics (position of the motif in the set of RNA molecules in which the motif was originally identified, p-value, odds ratio, BEAM score).
BRIO applies the Fisher’s Test to determine if a motif is enriched in the input RNA molecules with respect to a set of background RNAs. The background can be specified by the user. By default, all Rfam 15.0 sequences are considered (Bateman et al., 2011).
Data collected
BRIO compares the input RNA molecules with the secondary structure and sequence motifs identified in 422 RNA binding proteins and 69 protein domains analyzing 1244 CLIP experiments in 7 widely studied model organisms (Blin et al., 2014; Adinolfi et al., 2019).
| Motif type | # of motifs |
|---|---|
| sequence motifs | 8305 |
| structure motifs | 9292 |
Output
Once the analysis is complete, results are presented through an interactive dashboard organized into three primary tabs: Motif Mapping, Enriched Motifs, and Sequences Match.
1. Motif Mapping
The Motif Mapping tab provides an Interactive Motif Distribution Profile. This visualization displays each input RNA molecule as a separate lane, allowing users to observe the exact positioning of identified motifs. Sequence-based motifs are highlighted in green, while structure-based motifs are depicted in red.
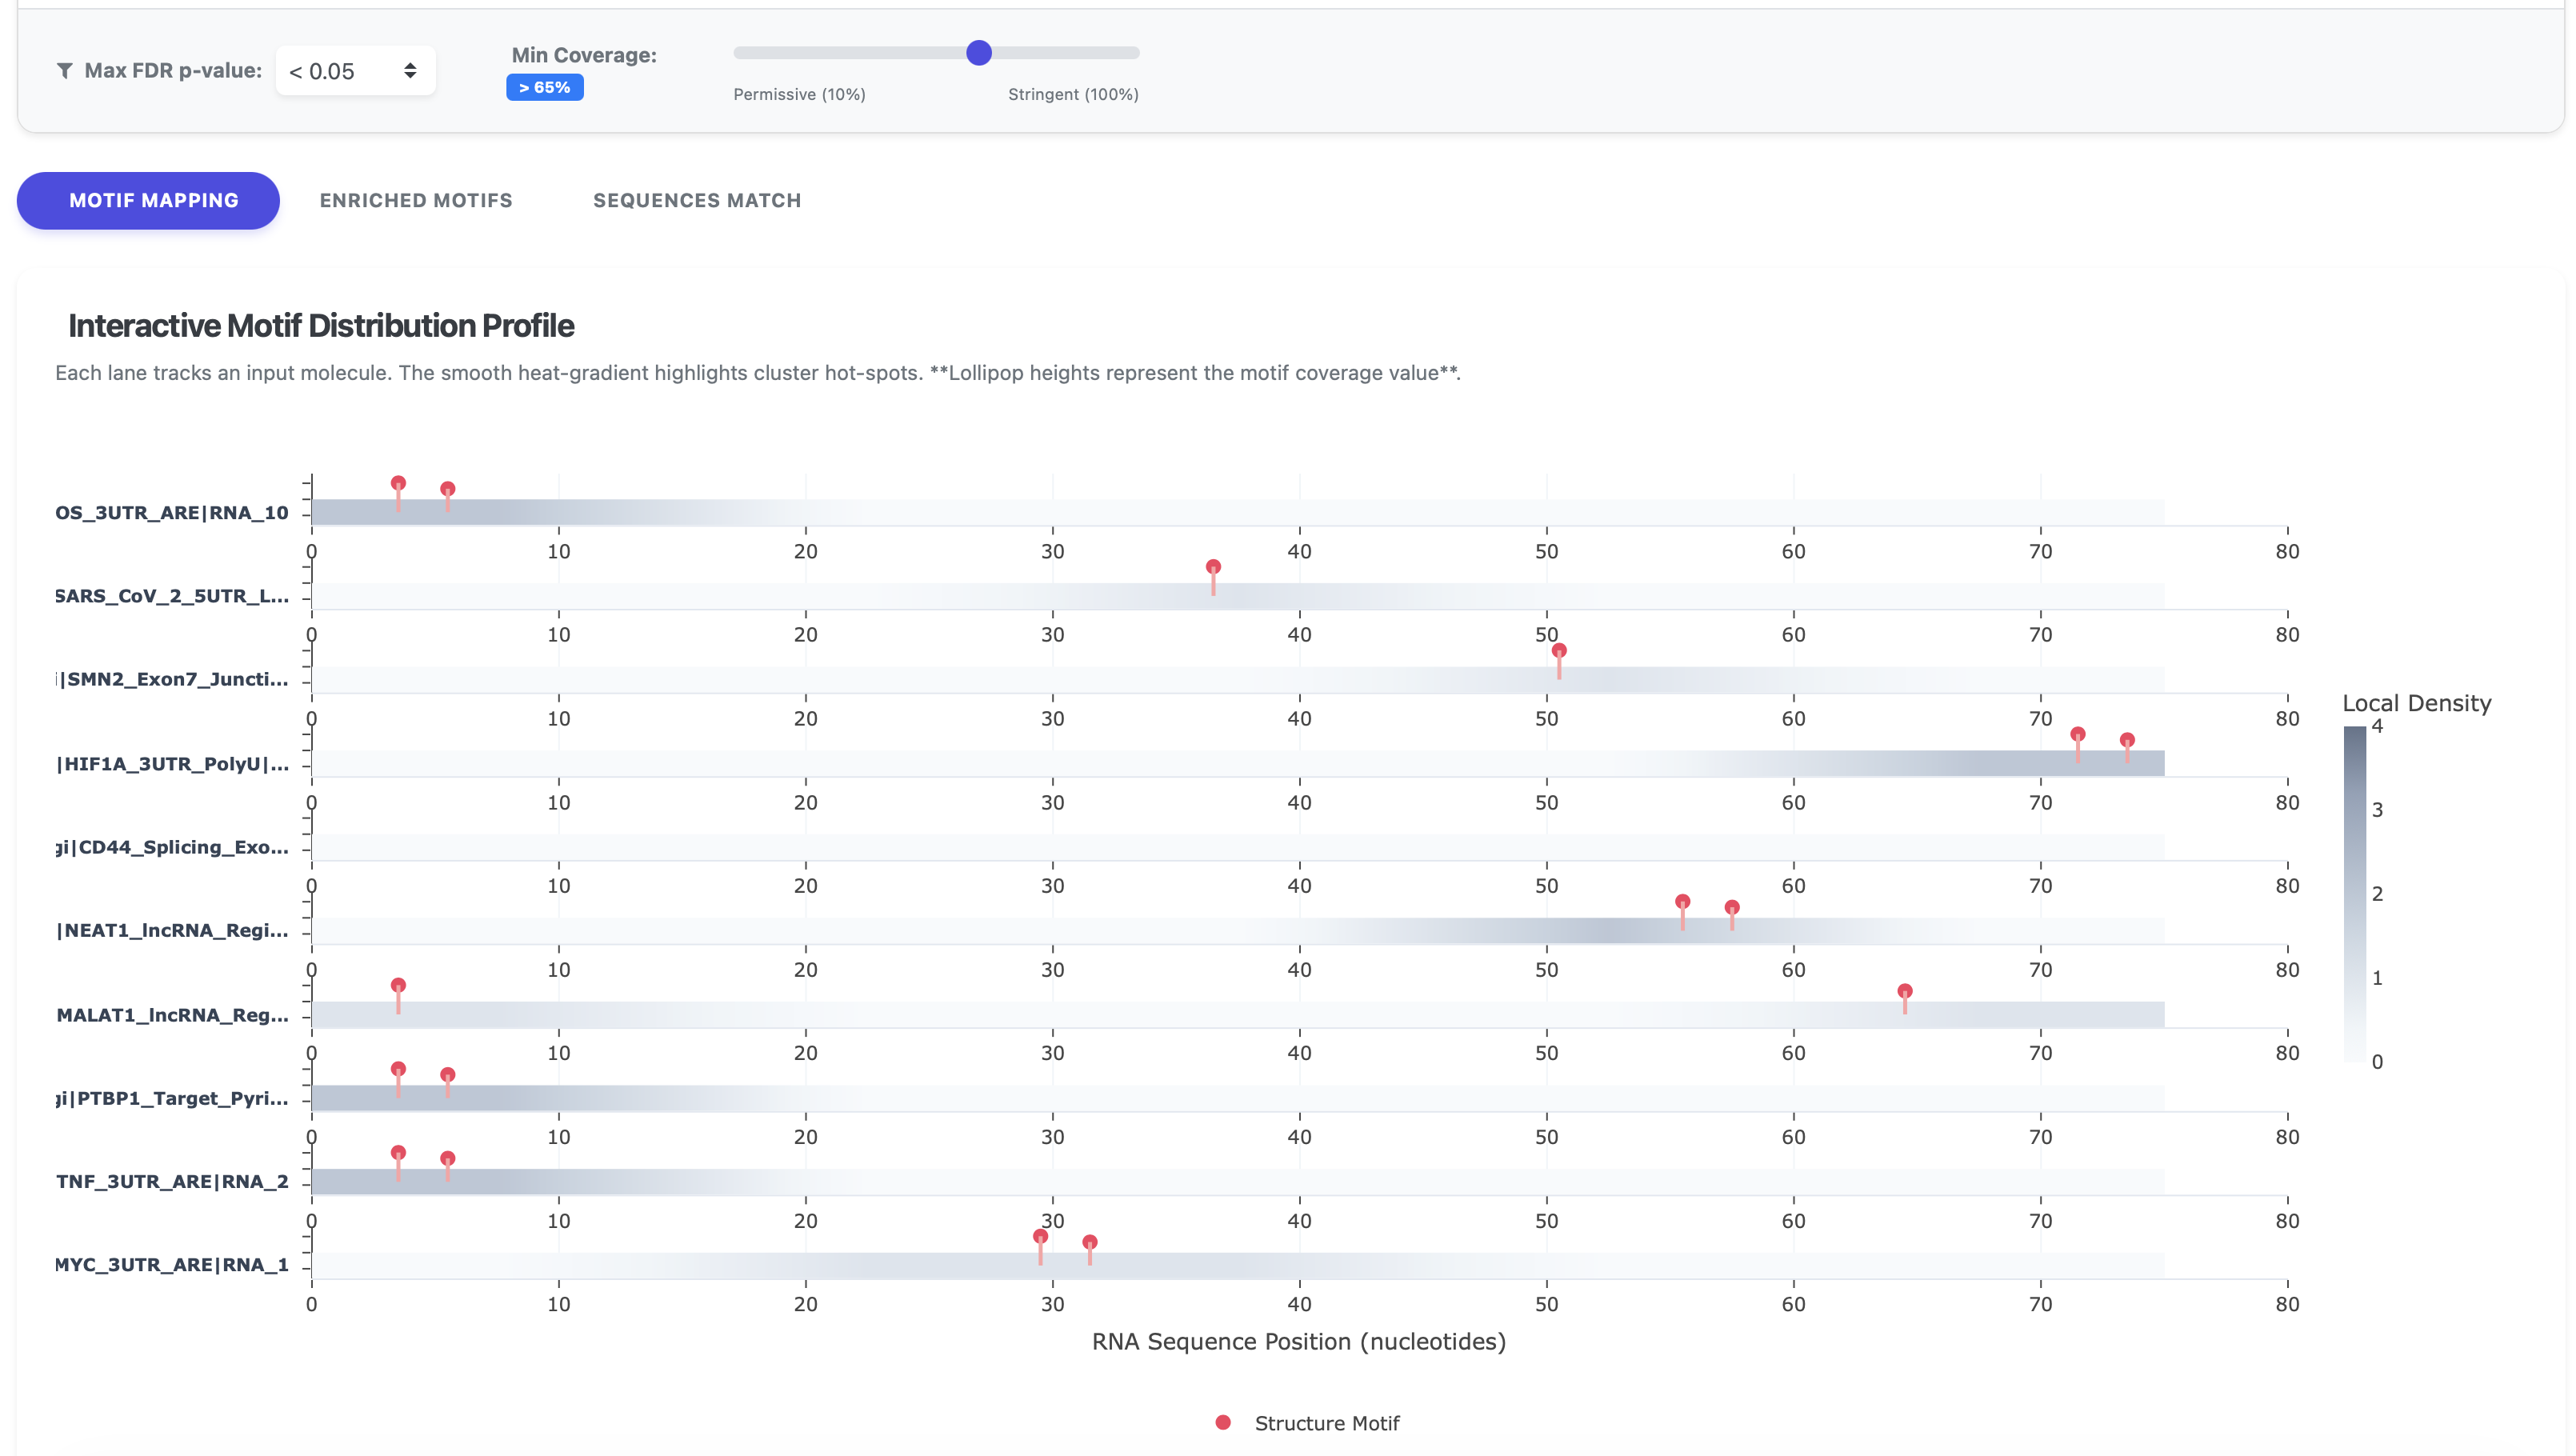
To refine the visualization and focus on the most significant findings, users can adjust dynamic filters located above the graph:
- Max FDR p-value: Filters motifs based on statistical significance. While the default is set to < 0.05, users can apply more stringent thresholds of 0.01 or 0.001.
- Min Coverage: Sets the required coverage percentage for a motif to be displayed. The default is set to > 50%, with the slider allowing adjustments ranging from 10% to 100%.
The background heat-gradient on each lane provides a quick visual reference for motif cluster hot-spots, while the height of the "lollipop" markers corresponds to the specific coverage value of each motif.
2. Enriched Motifs
The Enriched Motifs tab provides a detailed summary table of all RNA sequence and structural motifs that show statistically significant enrichment within your input dataset.
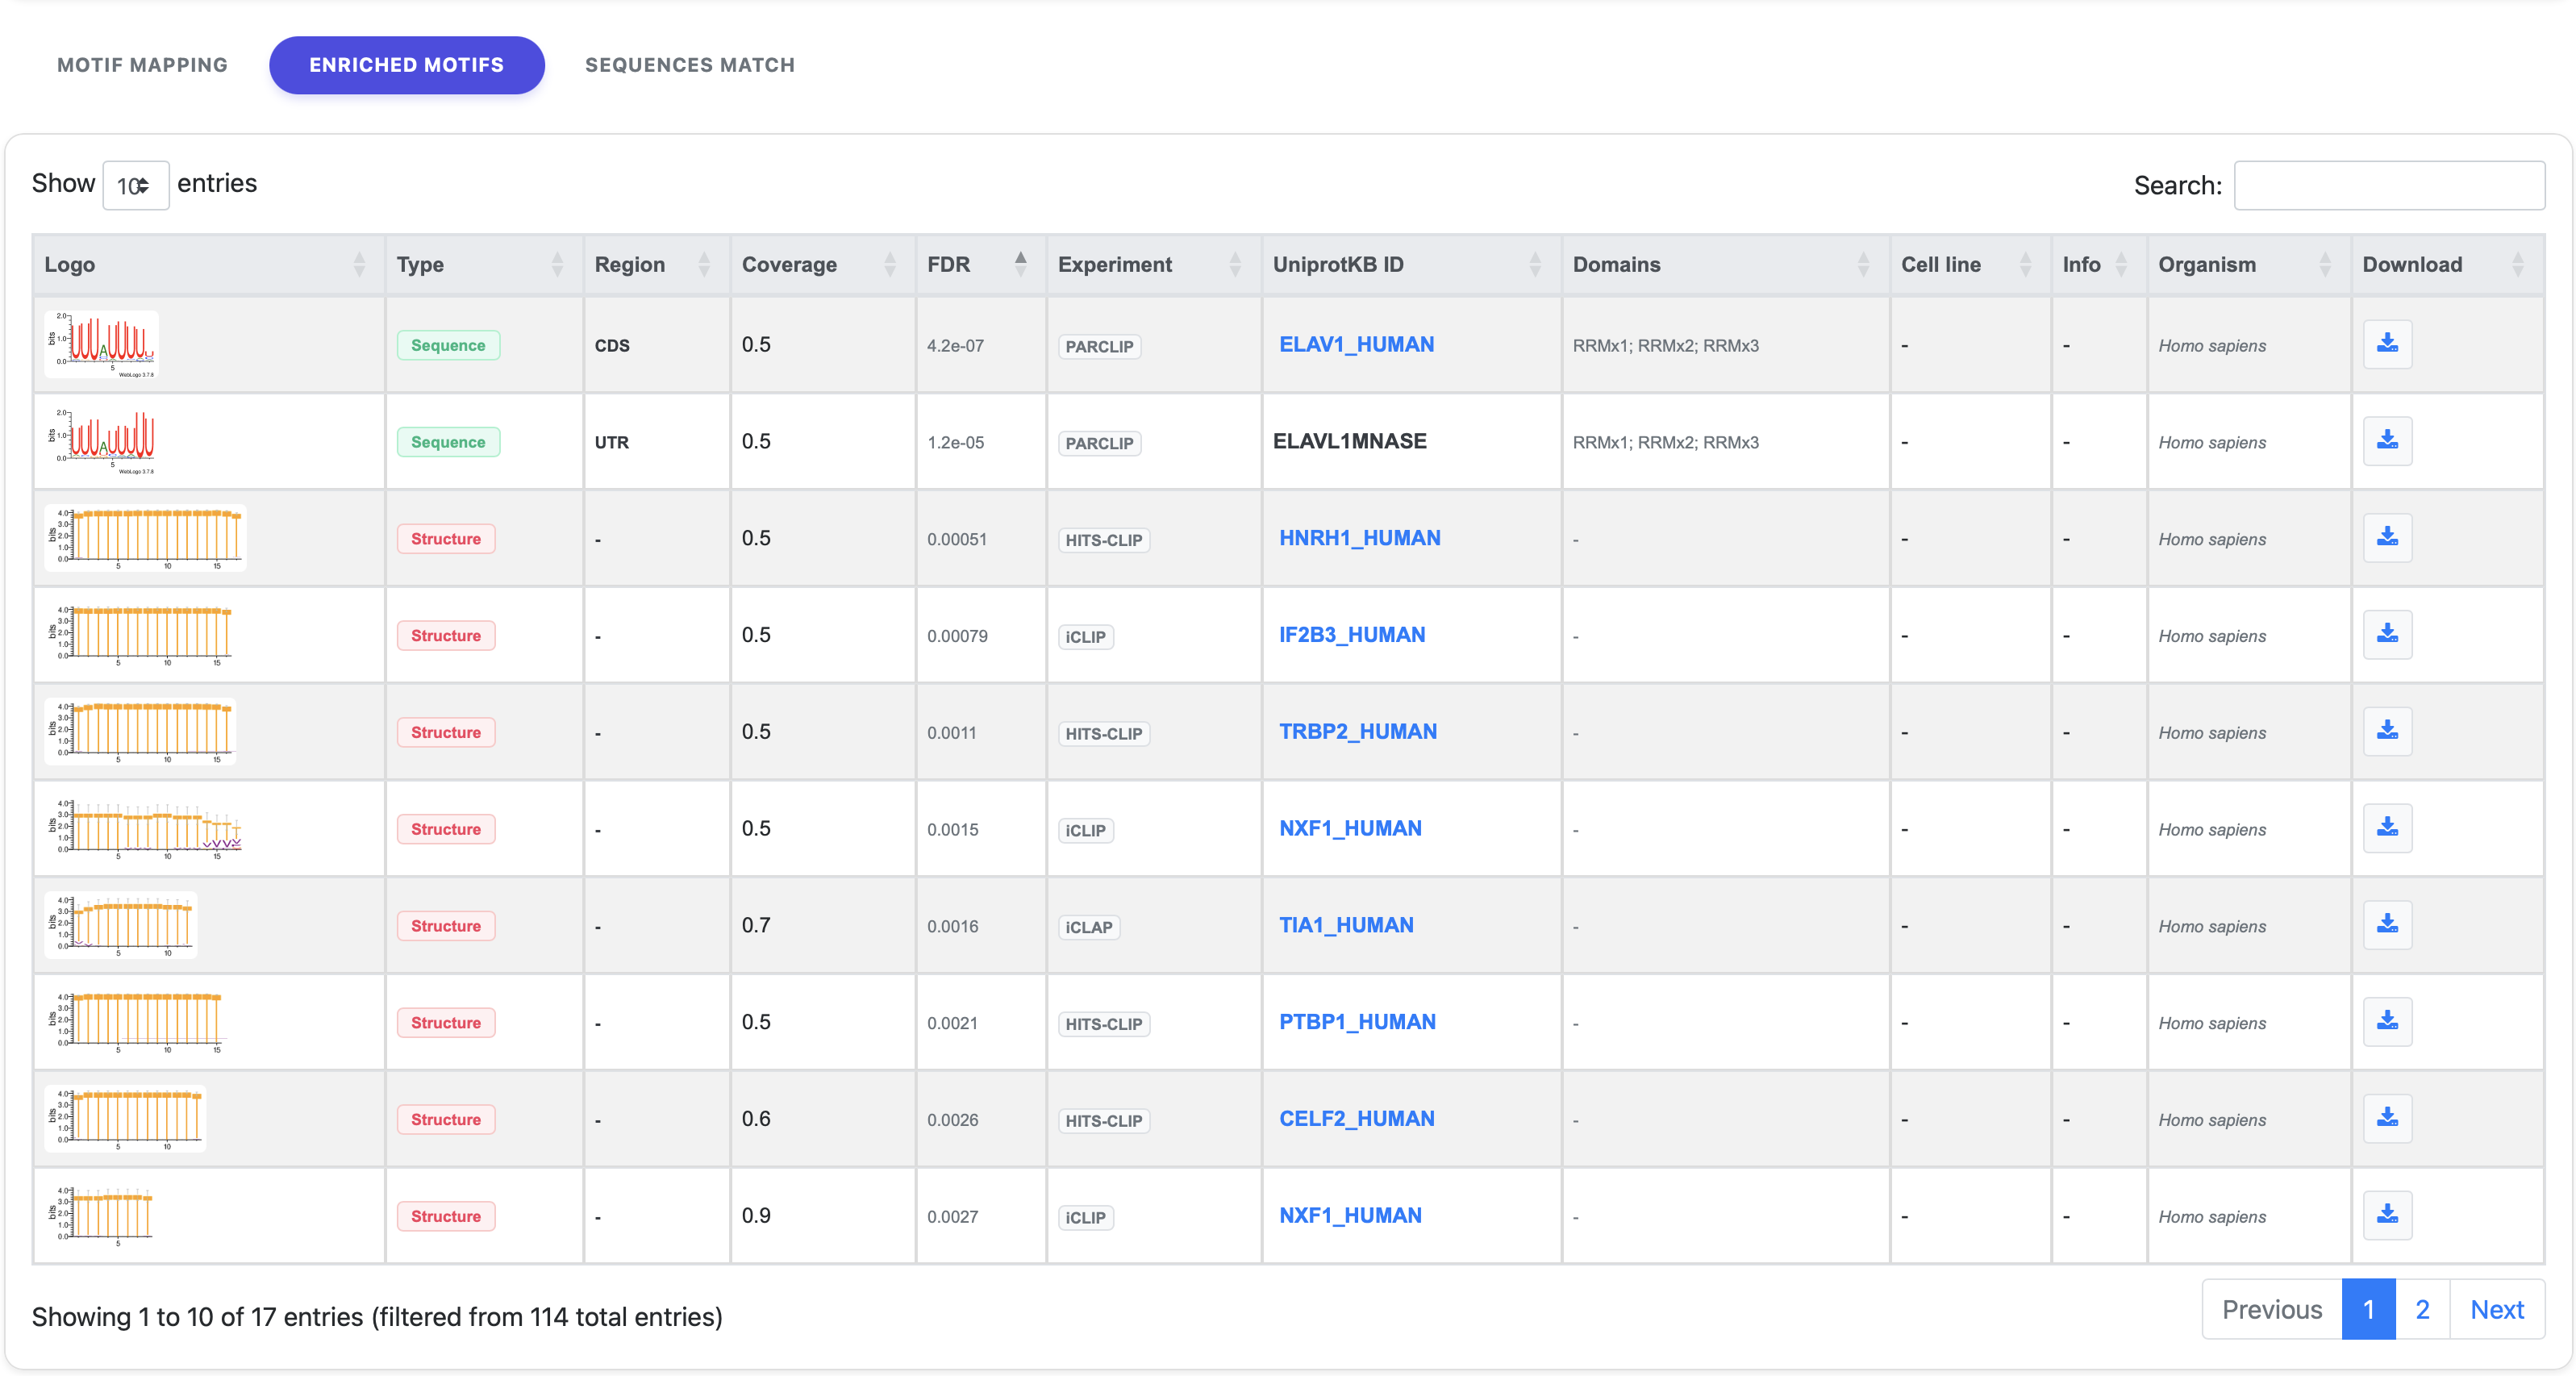
- Statistical Sorting: By default, motifs are sorted by their one-sided Fisher’s Exact Test p-value, ensuring that the most significant findings are displayed at the top.
- Motif Information: For each identified motif, the table provides its visual representation (qBEAR logo for structural motifs or IUPAC for sequence motifs), statistical metrics (p-value, coverage, BEAM score), and annotation data (associated RBP/domain, CLIP experiment type, and mapping regions).
- Interactive Features: The table contents can be sorted in ascending or descending order by clicking on the column headers.
- Download: A link is provided in the last column of each row, enabling users to download specific information related to that motif.
3. Sequences Match
The Sequences Match tab provides a per-molecule breakdown of all identified binding sites.
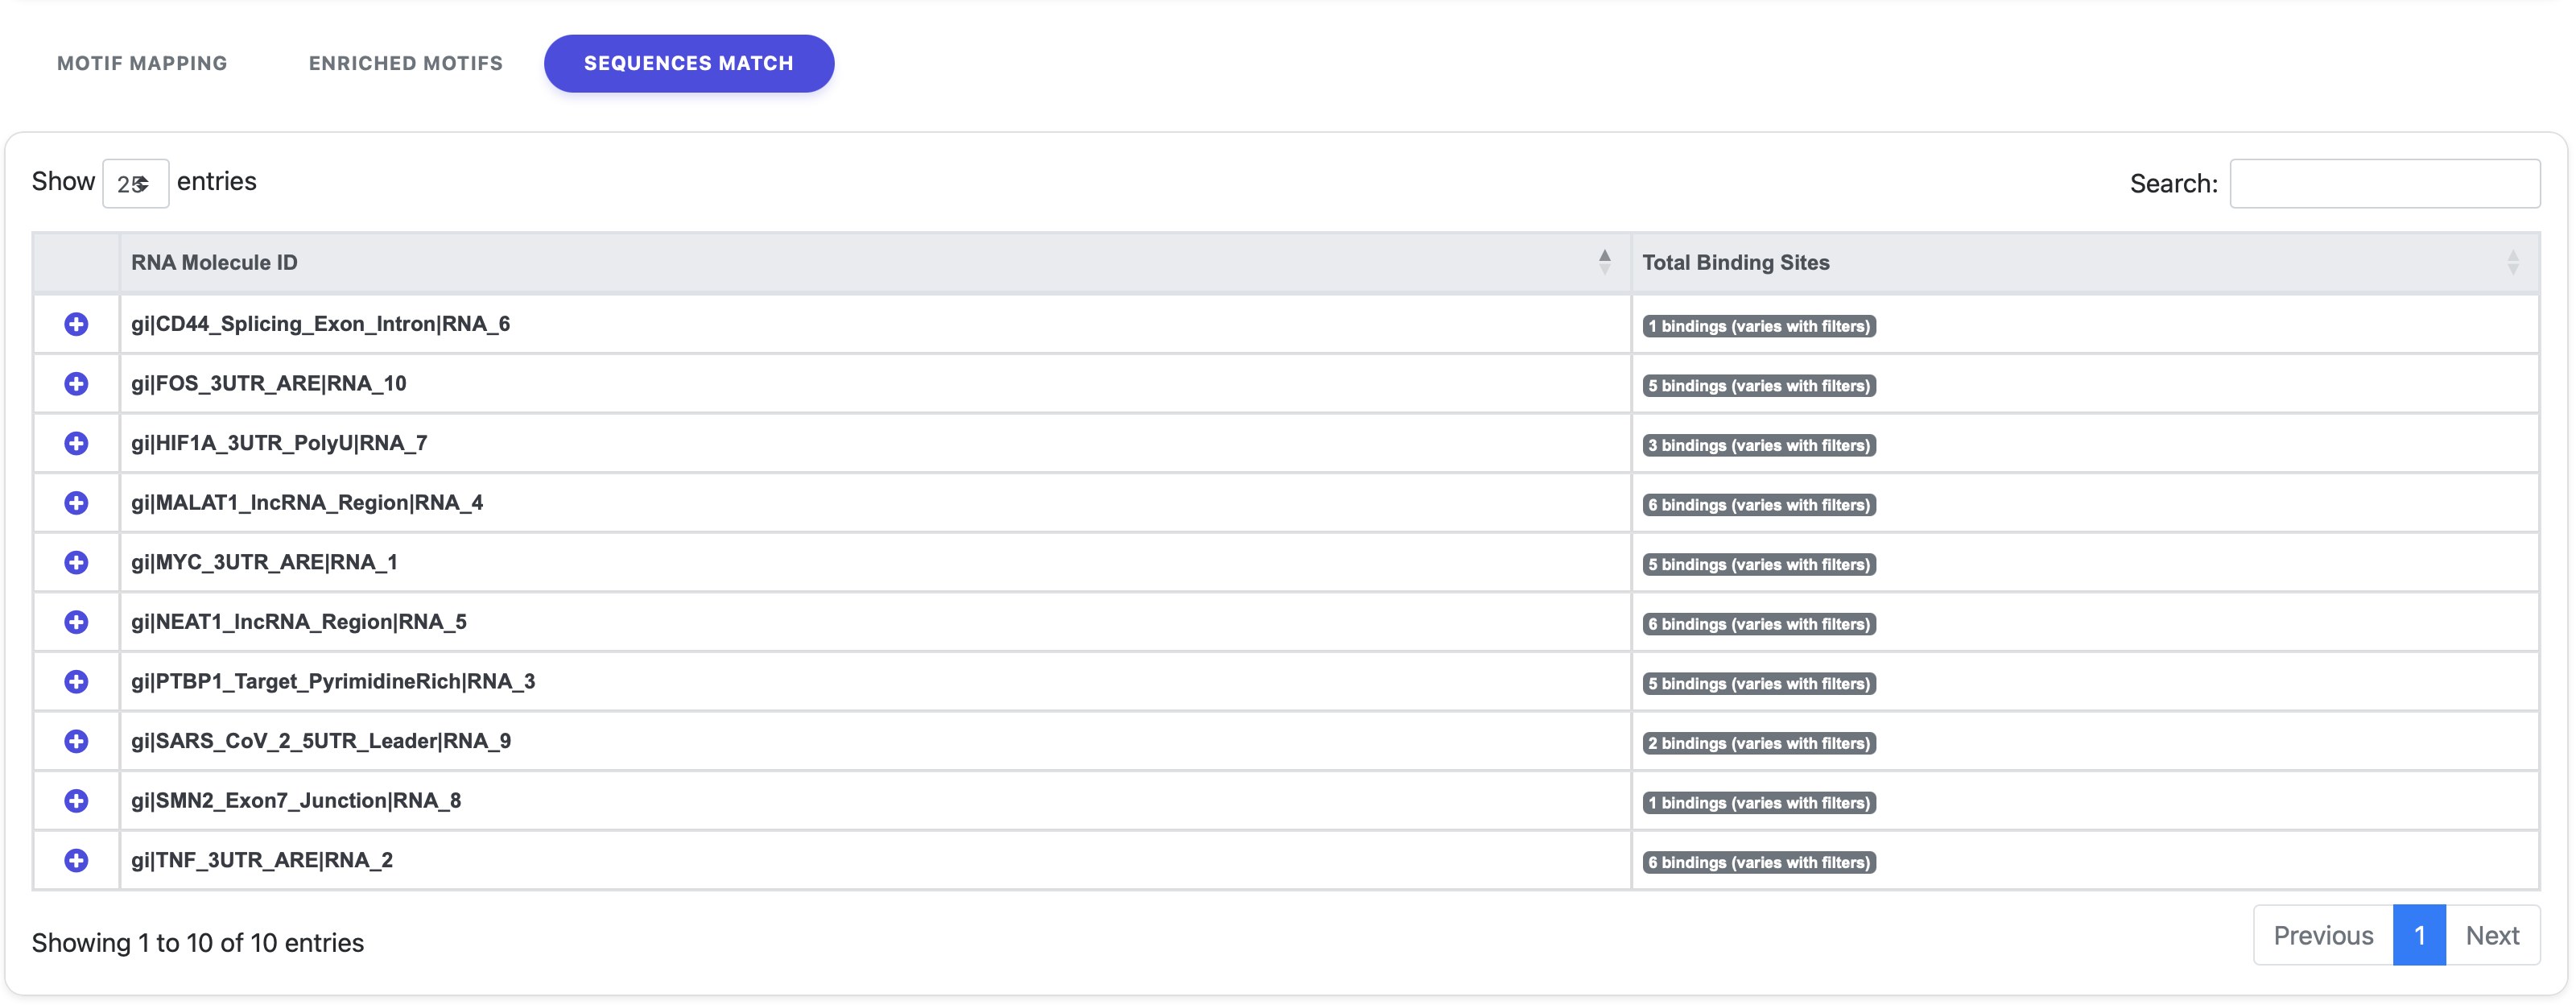
Each row of this table represents one of the input sequences given by the user, displaying the total number of bindings found. By clicking on the “+” symbol next to a sequence ID, another table will expand, containing detailed information about exact motif positions, motif representations, types, and the associated proteins for that specific sequence.
Encodings
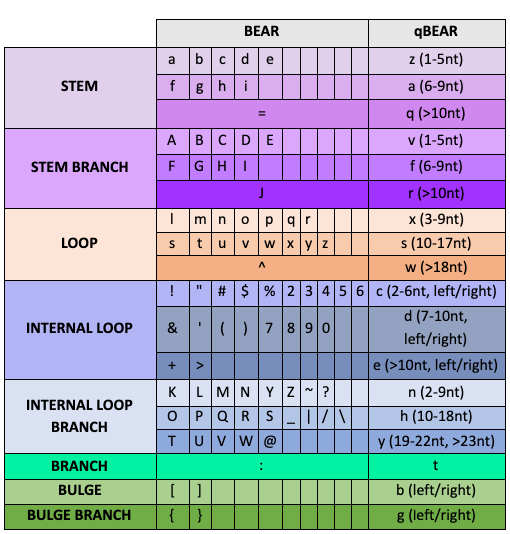
BEAR: the BEAR encoding represents each position of an RNA molecule with a character taken from a set of 83, each describing its structural context and its length (Mattei et al., 2014).
quickBEAR (qBEAR): qBEAR was originally developed as a way to show alignments of RNA structures in a Logo form (Crooks et al., 2004), where each position of an RNA molecule is described by one of 18 characters encoding for structural contexts and length groups (Pietrosanto et al., 2016).
Browser compatibility
| OS | Version | Chrome | Firefox | Microsoft Edge | Safari |
|---|---|---|---|---|---|
| MacOS | Catalina | 87.0.4280 | 84.0 | n/a | 14.0 |
| MacOS | High Sierra | 87.0.4280 | 81.0.1 | n/a | 13.1.2 |
| Linux | Ubuntu 20.04 | 87.0.4280 | 84.0 | n/a | n/a |
| Windows | 10 | 87.0.4280 | 84.0 | 87.0.664.66 | n/a |
Citation
Please cite us if you make use of BRIO:
Guarracino A, Pepe G, Ballesio F, Adinolfi M, Pietrosanto M, Sangiovanni E, Vitale I, Ausiello G, Helmer-Citterich M.
BRIO: a web server for RNA sequence and structure motif scan.
Nucleic Acids Res (Link).
References
- Adinolfi M, Pietrosanto M, Parca L, Ausiello G, Ferrè F, Helmer-Citterich M. (2019) Discovering sequence and structure landscapes in RNA interaction motifs. Nucleic Acids Res, 47:4958-4969.
- Bateman, A., Finn, R.D. and Petrov, A.I. (2017) Rfam 13.0: shifting to a genome-centric resource for non-coding RNA families. Nucleic Acids Res., 46, 335–342.
- Blin, K., Dieterich, C., Wurmus, R., Rajewsky, N., Landthaler, M., & Akalin, A. (2014). DoRiNA 2.0—upgrading the doRiNA database of RNA interactions in post-transcriptional regulation. Nucleic Acids Research.
- Crooks, Gavin E., et al. (2004) "WebLogo: a sequence logo generator." Genome research 14.6: 1188-1190.
- Lorenz R, Bernhart S.H., Hoener zu Siederdissen C., Tafer H., Flamm C., Stadler P.F. and Hofacker I.L. (2011), "ViennaRNA Package 2.0", Algorithms for Molecular Biology: 6:26.
- Mattei, E., Ausiello, G., Ferrè, F. and Helmer-Citterich, M. (2014) A novel approach to represent and compare RNA secondary structures. Nucleic Acids Res., 42, 6146–6157.
- Pietrosanto, M., Mattei, E., Helmer-Citterich, M. and Ferrè, F. (2016) A novel method for the identification of conserved structural patterns in RNA: From small scale to high-throughput applications. Nucleic Acids Res., 44, 8600–8609.